The global chia seed market is currently valued at approximately $1.33 Billion , with a projected growth rate (CAGR) of roughly 14% . The market is shifting from a niche health food to a primary functional ingredient in mainstream food processing.
Global Market Share
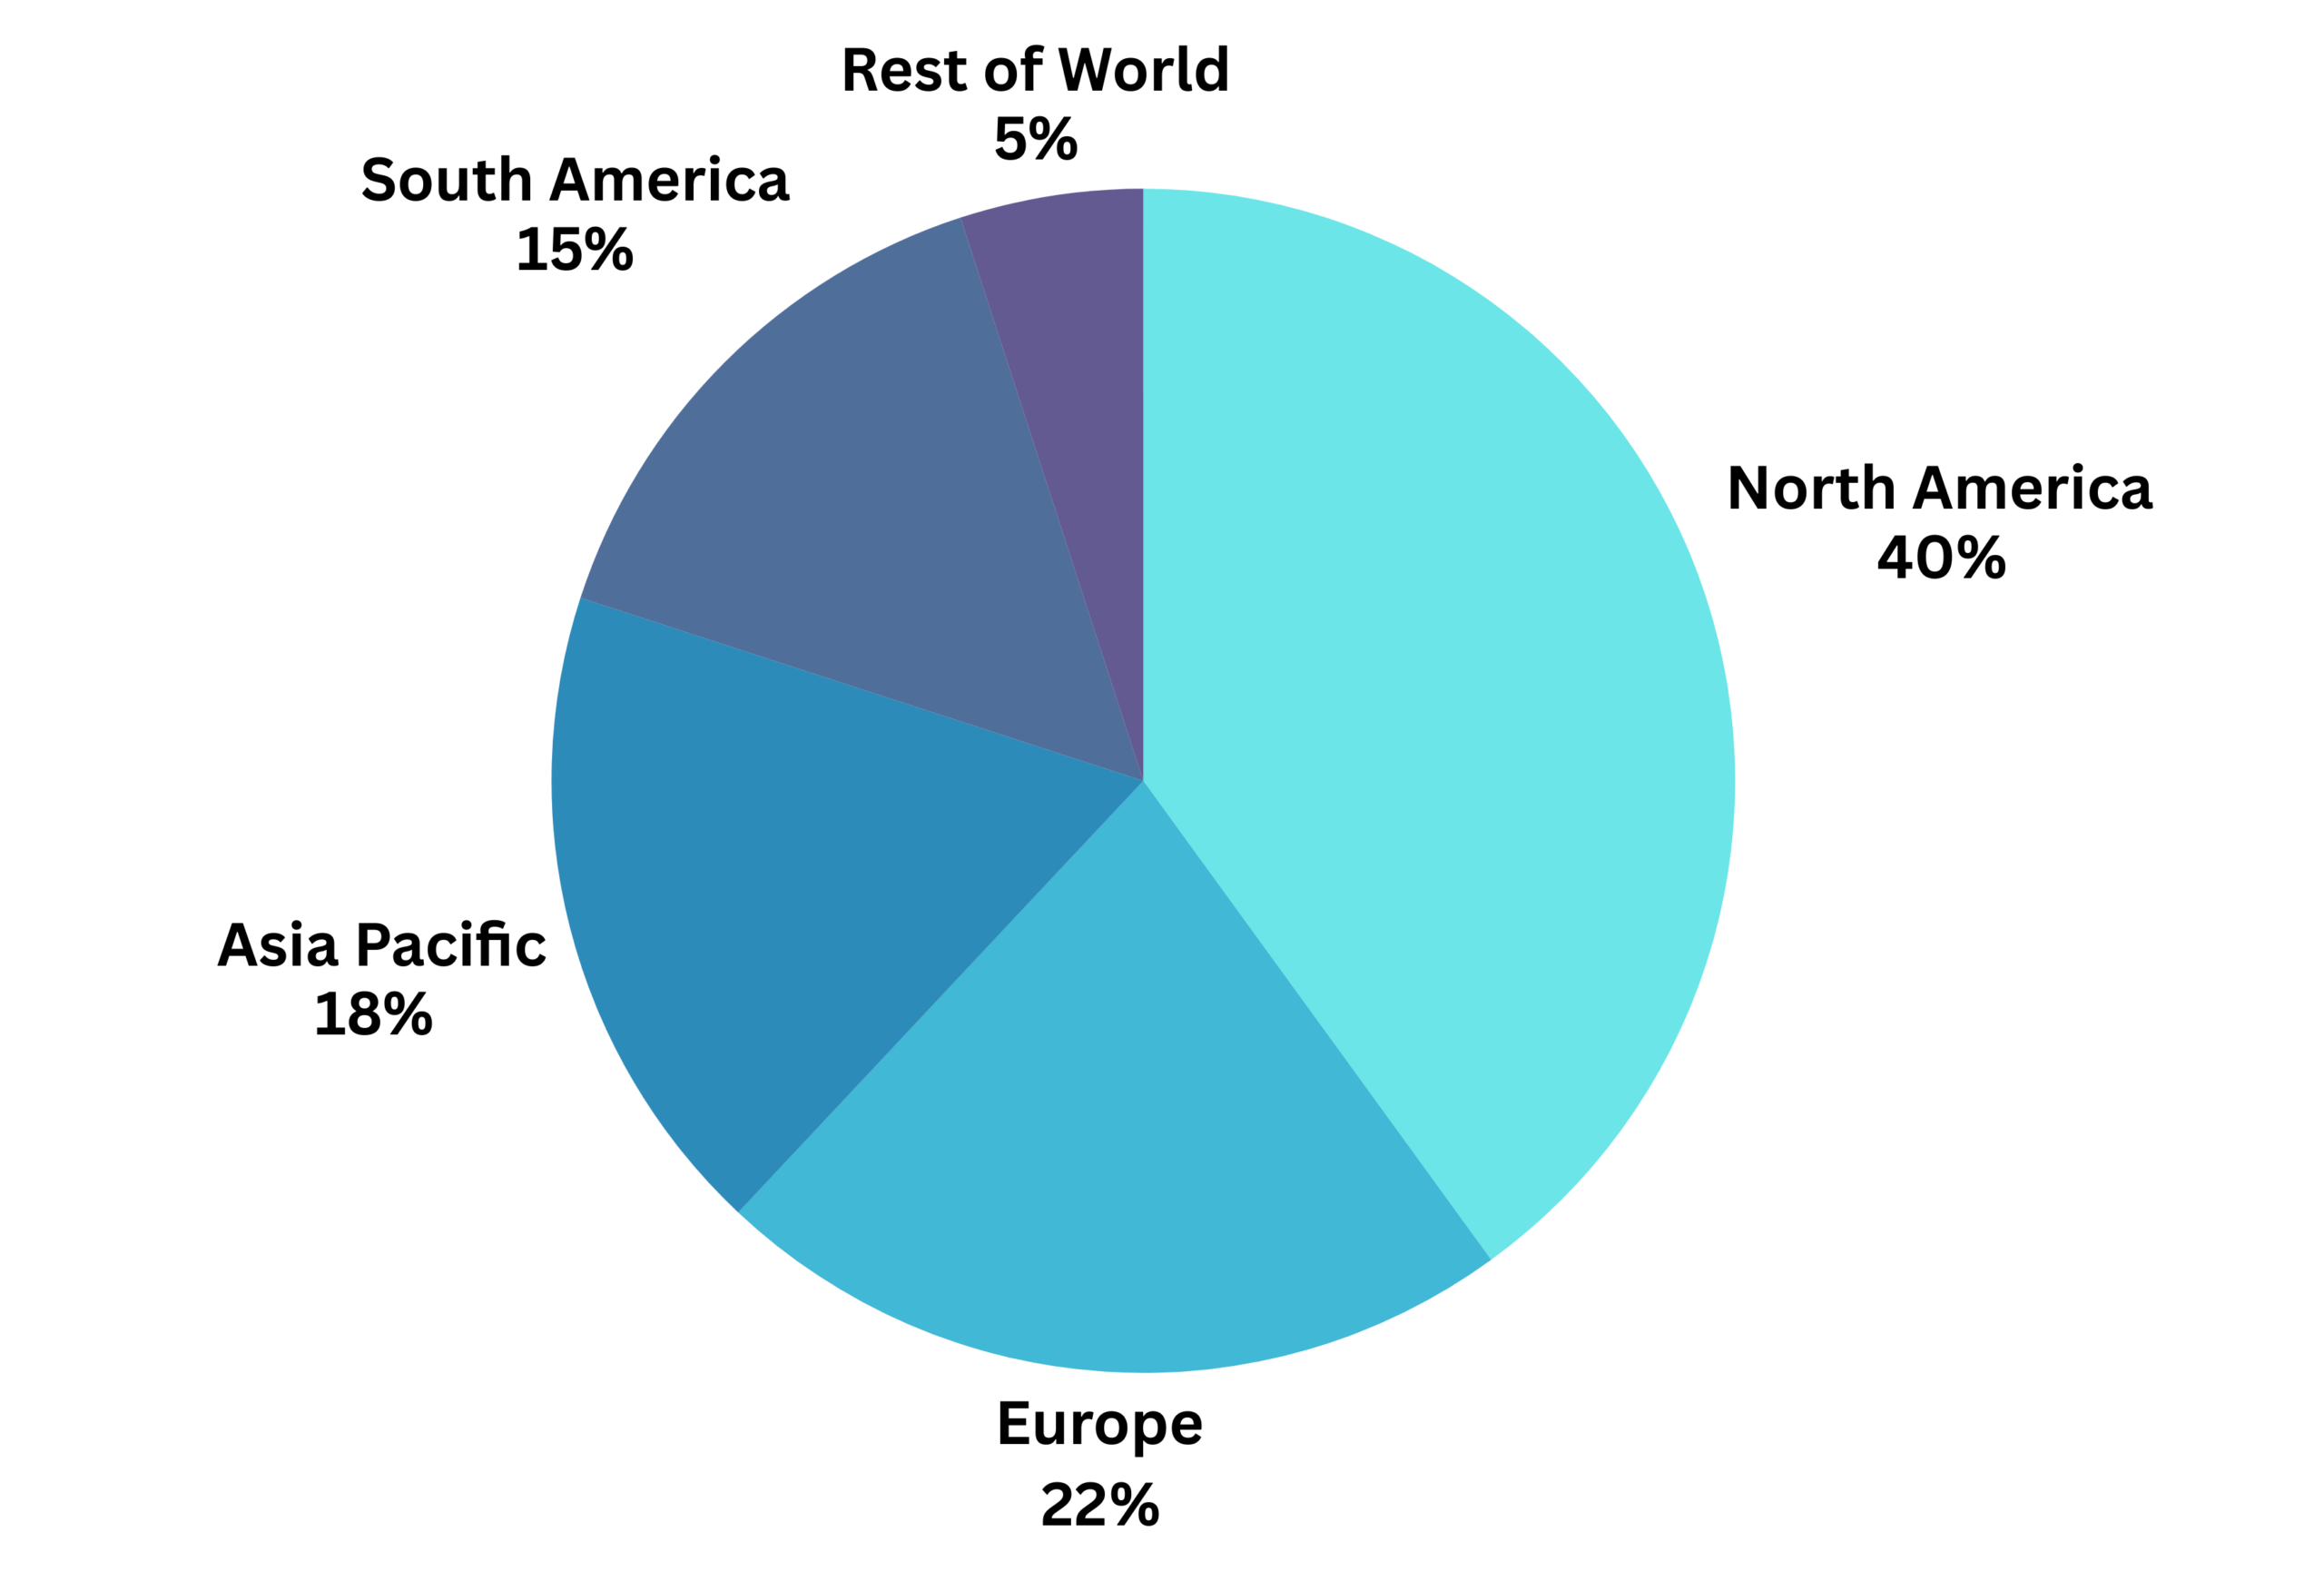
The market is geographically concentrated in production but diverse in consumption. North America remains the leader, while the Asia- Pacific region is the fastest-growing frontier.
Regional Market Share (See Chart 1)
Global Chia Seeds Market Share by Region (2026 Estimate)
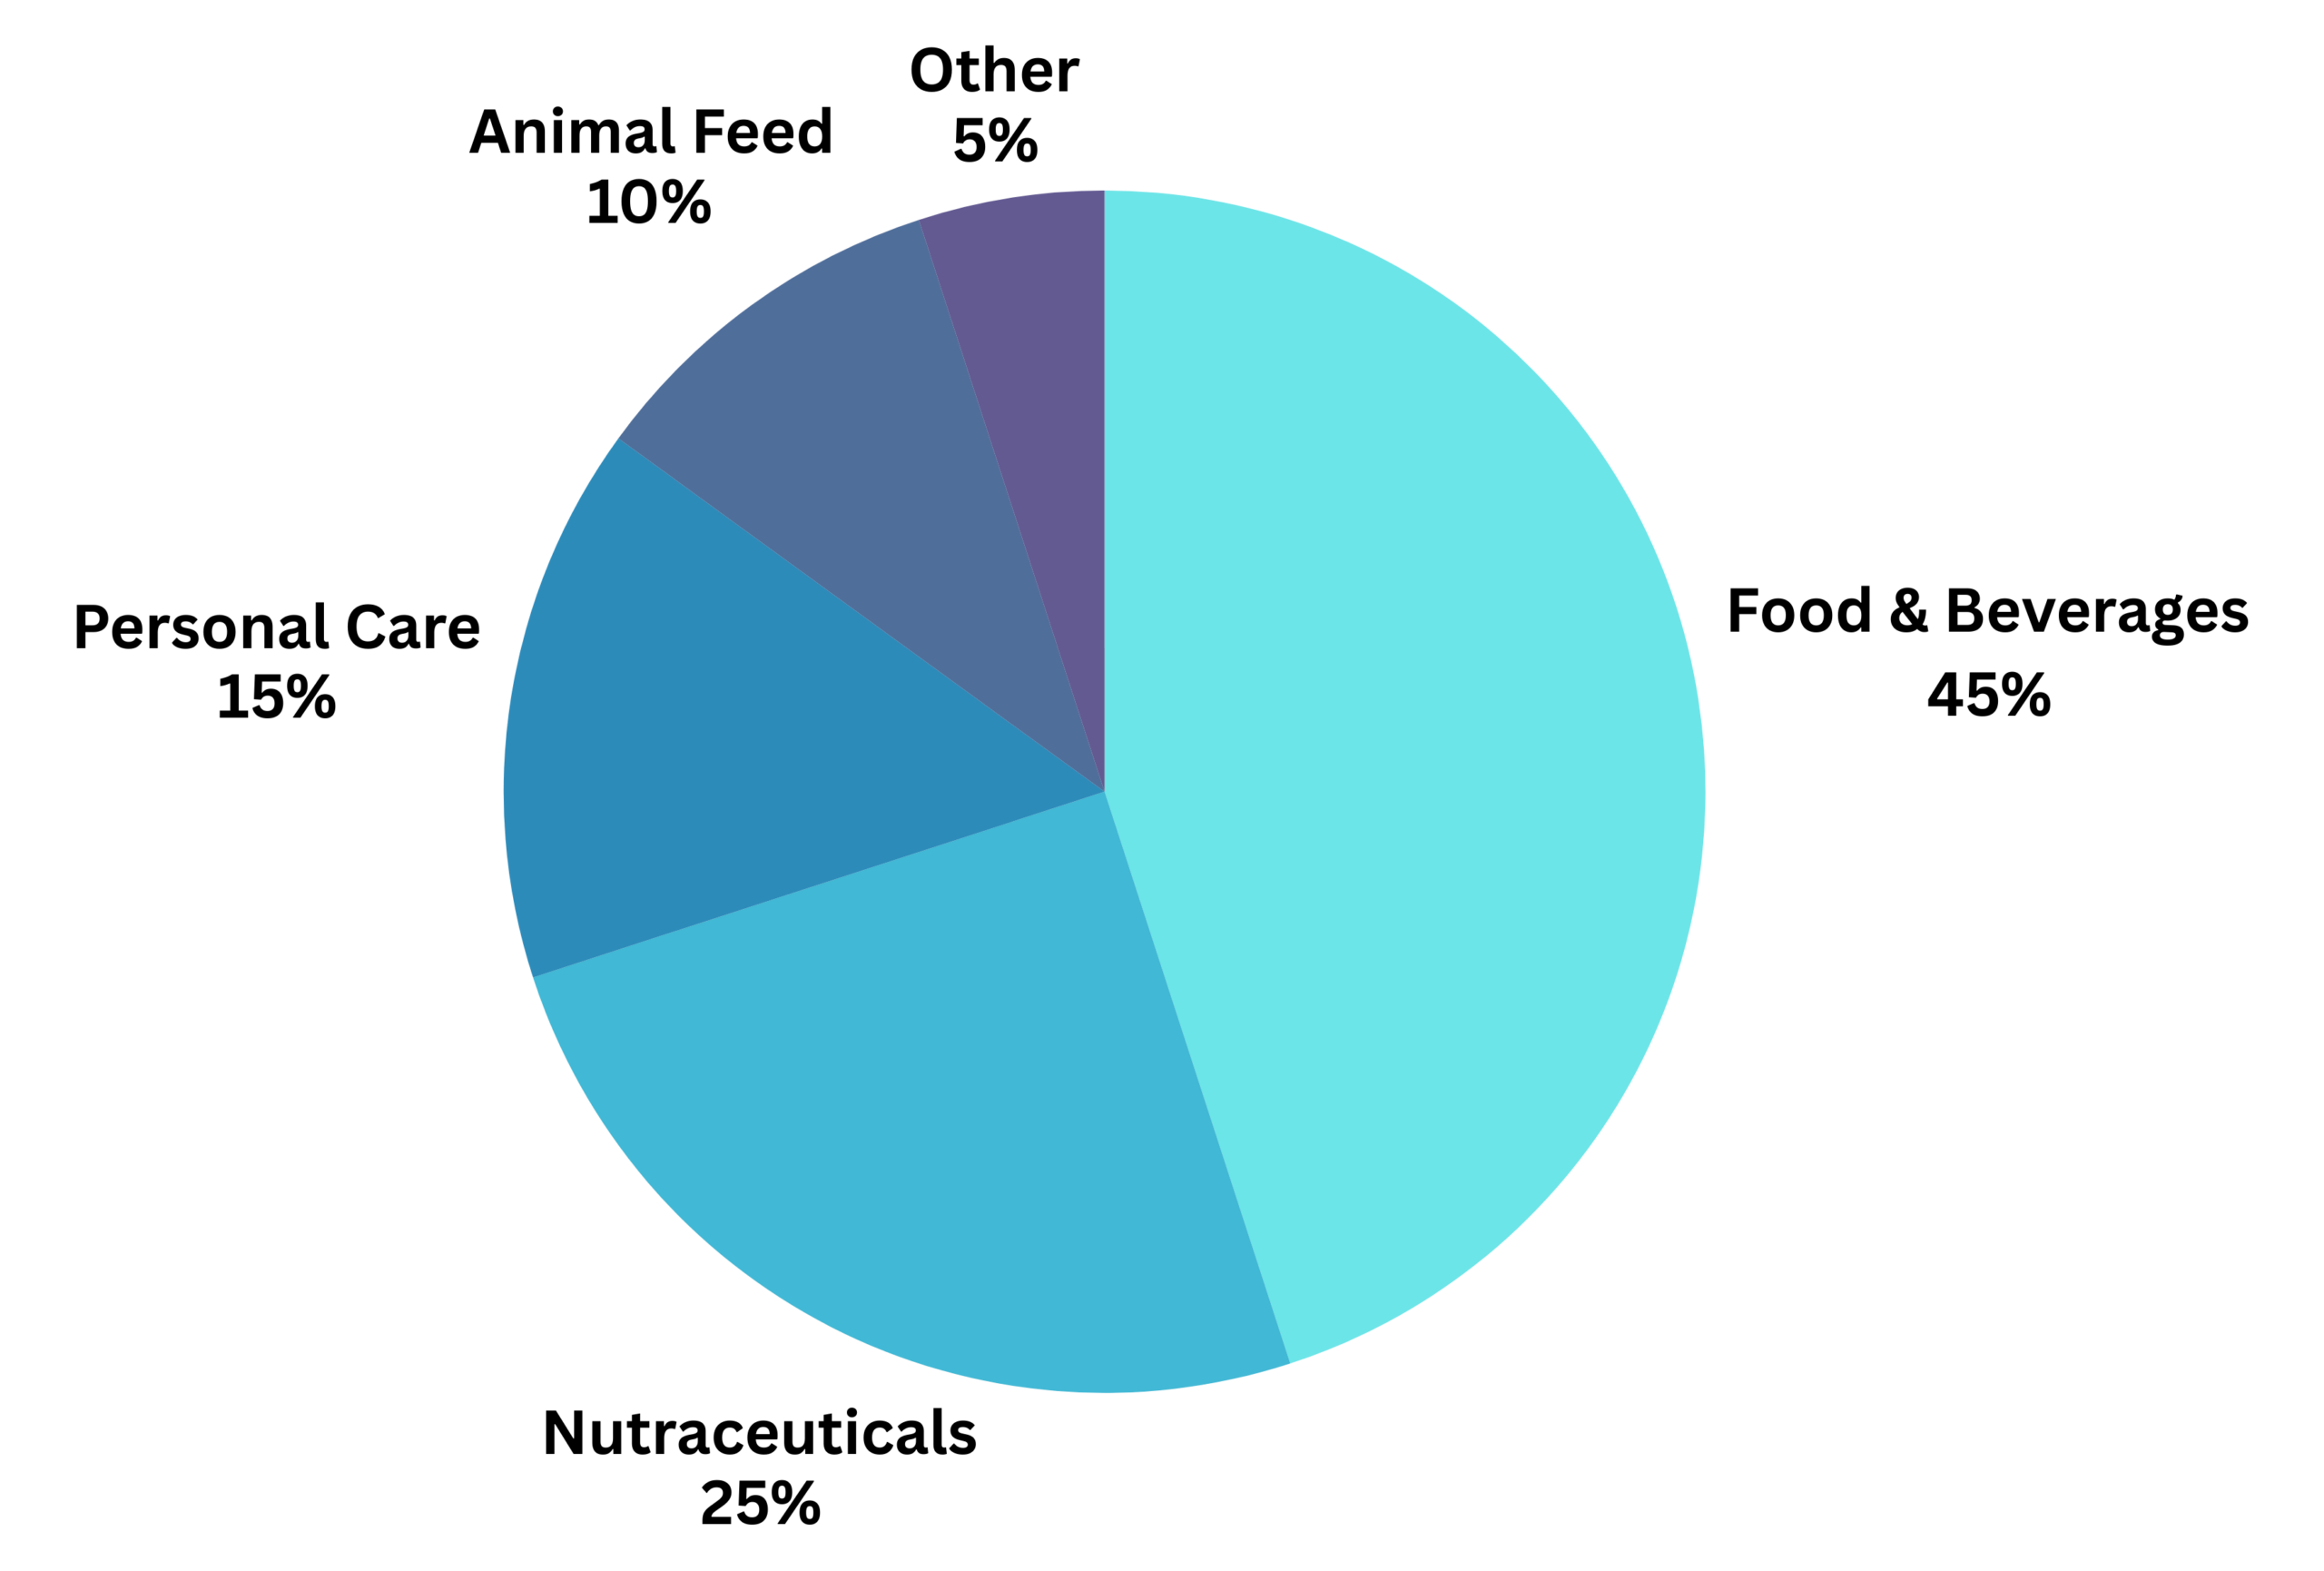
Market Share by Application (See Chart 2)
Global Chia Seeds Market Share by Application (2026)
2. Price Trends: Increases and Decreases
The 2025-2026 season is marked by significant volatility due to climate events and logistical shifts.
| Trend | Market Driver | Financial |
|---|---|---|
| Increase | Climate Impact (La Niña) | Reduced yields in South America by 15-20%, pushing spot prices above $4.00/kg. |
| Increase | Organic Premium | Certified organic products command a 15-25% price premium over conventional seeds. |
| Decrease | Diversified Sourcing | New irrigation in Peru and farming in India has increased off-season supply, stabilizing prices during peak demand. |
| Decrease | E-commerce Optimization | Al-managed logistics and direct-to-consumer platforms have lowered retail prices by 10- 20% vs. physical specialty stores. |
How FitTree Helps Choose the Perfect Product
In a market where “Budget” and “Premium” labels can be misleading, FitTree provides an Al-driven vetting process to ensure you get the highest nutritional value for your money.
- 1. Nutrient-to-Price Mapping: FitTree calculates the price per gram of Alpha-Linolenic Acid (ALA) and Fiber. A cheap bag may have lower nutrient density; FitTree identifies which brand offers the most “health per dollar.
- 2. Batch Purity Analysis: By scanning product QR codes, FitTree cross-references third-party laboratory Certificates of Analysis (COA) to verify the absence of heavy metals (like Lead or Cadmium) and pesticide drift common in bulk imports.
- 3. Sourcing Transparency: FitTree assigns a “Sourcing Score” based on Blockchain Traceability. It prioritizes brands that source directly from cooperatives, ensuring fair pay for farmers and ethical environmental practices.
- 4. Personalized Matching: * For Baking: FitTree recommends
White Chia for its neutral color.
• For Smoothies: It recommends Milled/Ground Chia for maximum nutrient absorption.
• For Value: It identifies bulk organic options like Terrasoul or Amoseeds that meet purity standards at wholesale prices.