The global chia seed market is currently valued at approximately $1.33 Billion , with a projected growth rate (CAGR) of roughly 14% . The market is shifting from a niche health food to a primary functional ingredient in mainstream food processing.
Global Market Share
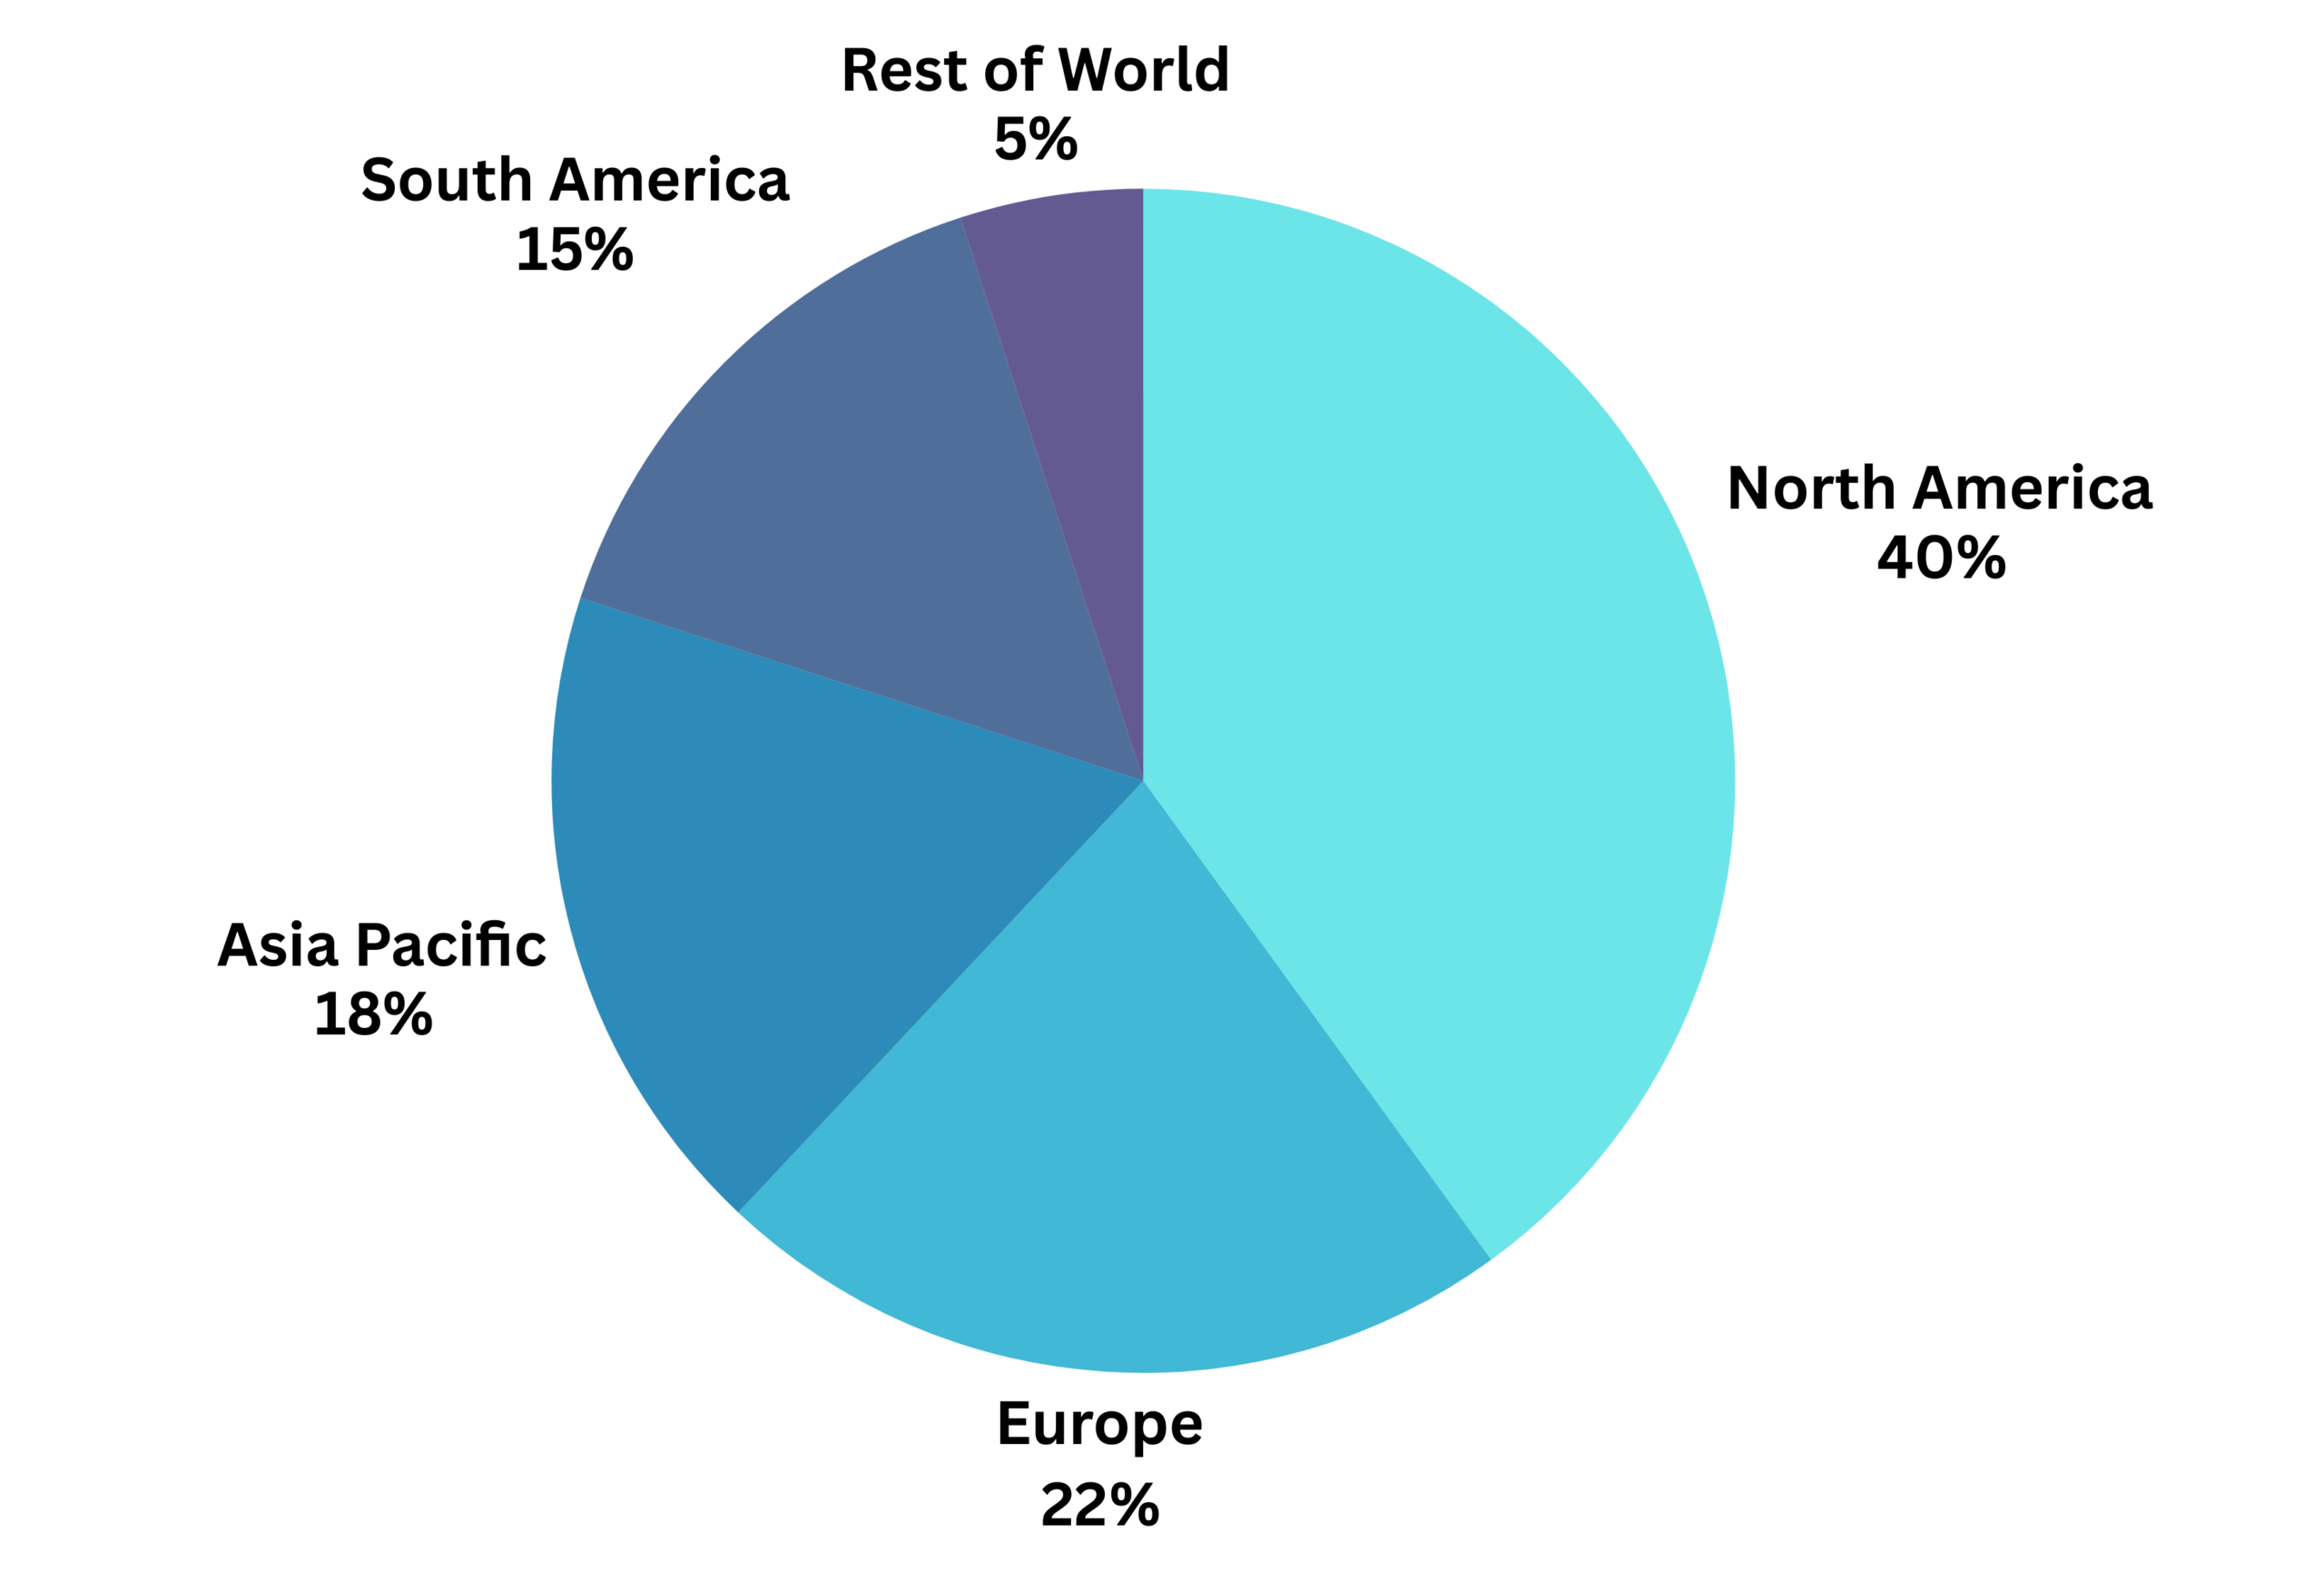
The market is geographically concentrated in production but diverse in consumption. North America remains the leader, while the Asia- Pacific region is the fastest-growing frontier.
Regional Market Share (See Chart 1)
North America (40%):
Driven by the massive expansion of keto, vegan, and plant-based protein sectors.
Europe (22%):
Highly focused on organic certification and “clean-label” transparency.
Asia-Pacific (18%):
Rapid growth in urban centers of China and India due to rising health consciousness.
South America (15%):
The global production powerhouse, particularly Bolivia and Paraguay.
Rest of World (5%):
Emerging markets in the Middle East and Oceania
Global Chia Seeds Market Share by Region (2026 Estimate)
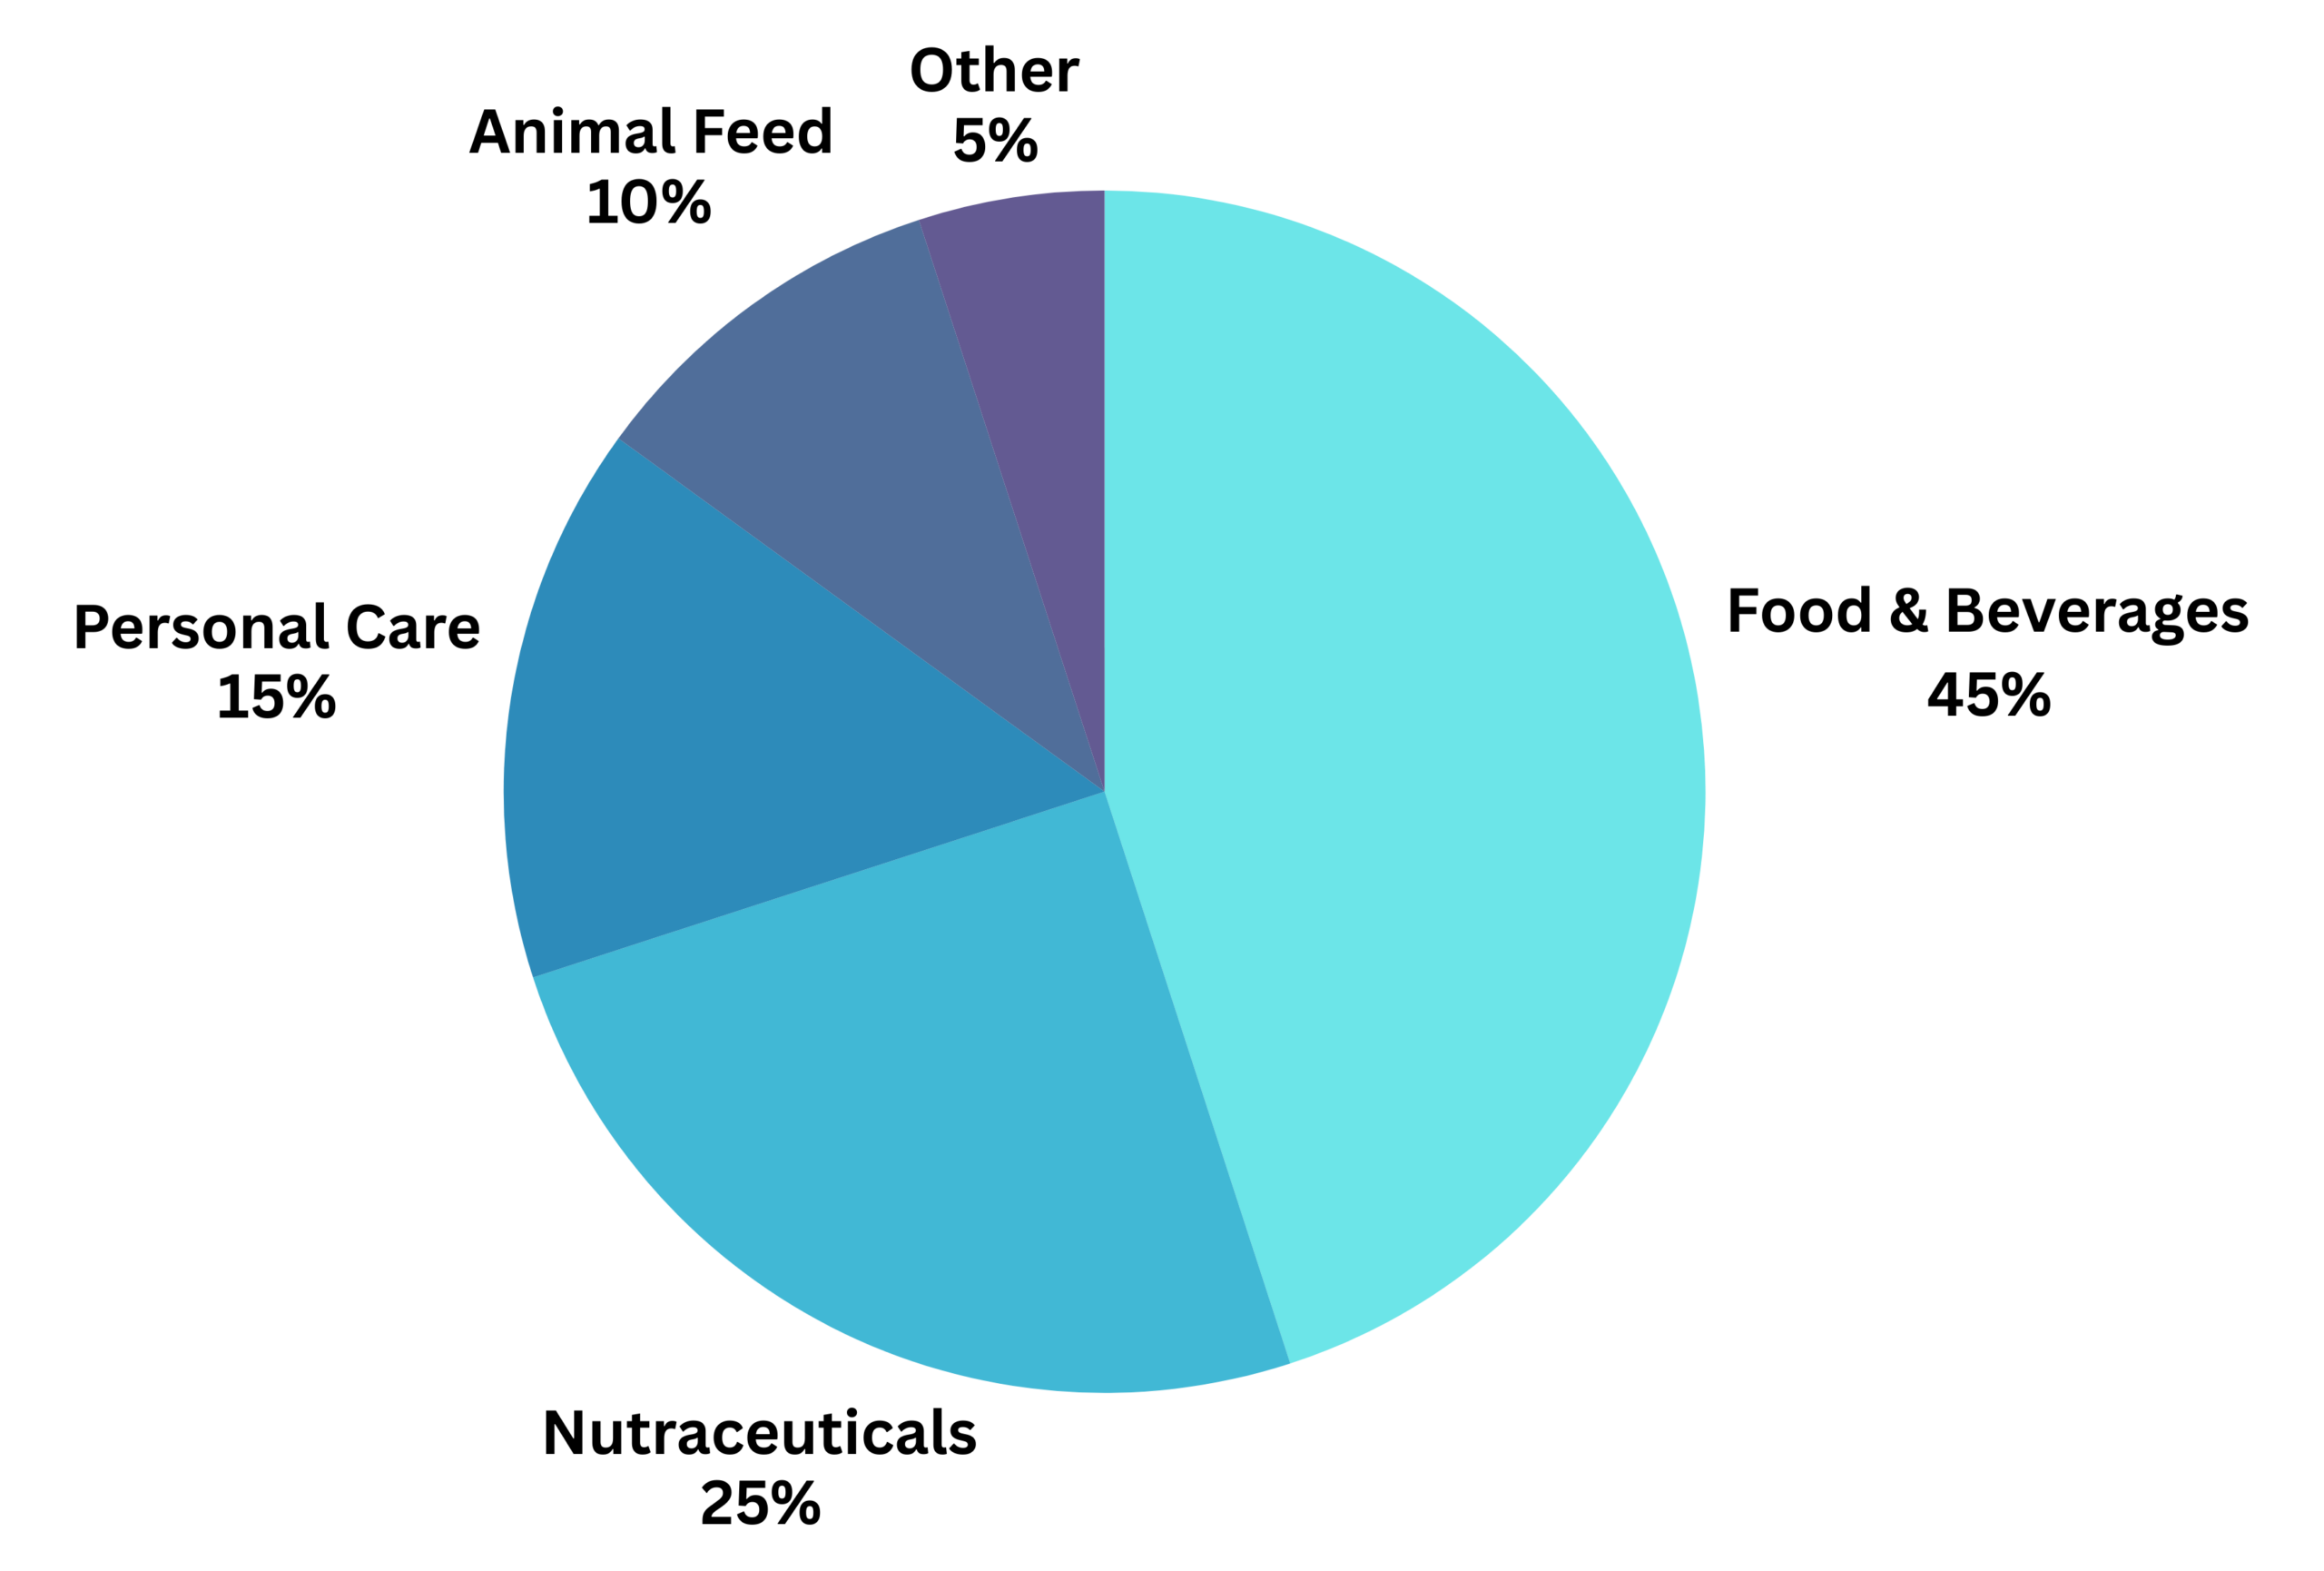
Market Share by Application (See Chart 2)
Food & Beverages (45%):
Includes energy bars, smoothies, and dairy alternatives.
Nutraceuticals (25%):
High-concentration Omega-3 capsules and protein supplements.
Personal Care (15%):
Growing use of chia oil in anti-aging skincare and hair products.
Animal Feed (10%):
Utilized for producing Omega-3 enriched eggs and poultry.
Other (5%):
Specialty agricultural uses.
Global Chia Seeds Market Share by Application (2026)
2. Price Trends: Increases and Decreases
The 2025-2026 season is marked by significant volatility due to climate events and logistical shifts.
| Trend | Market Driver | Financial |
|---|---|---|
| Increase | Climate Impact (La Niña) | Reduced yields in South America by 15-20%, pushing spot prices above $4.00/kg. |
| Increase | Organic Premium | Certified organic products command a 15-25% price premium over conventional seeds. |
| Decrease | Diversified Sourcing | New irrigation in Peru and farming in India has increased off-season supply, stabilizing prices during peak demand. |
| Decrease | E-commerce Optimization | Al-managed logistics and direct-to-consumer platforms have lowered retail prices by 10- 20% vs. physical specialty stores. |
How FitTree Helps Choose the Perfect Product
In a market where “Budget” and “Premium” labels can be misleading, FitTree provides an Al-driven vetting process to ensure you get the highest nutritional value for your money.
- 1. Nutrient-to-Price Mapping: FitTree calculates the price per gram of Alpha-Linolenic Acid (ALA) and Fiber. A cheap bag may have lower nutrient density; FitTree identifies which brand offers the most “health per dollar.
- 2. Batch Purity Analysis: By scanning product QR codes, FitTree cross-references third-party laboratory Certificates of Analysis (COA) to verify the absence of heavy metals (like Lead or Cadmium) and pesticide drift common in bulk imports.
- 3. Sourcing Transparency: FitTree assigns a “Sourcing Score” based on Blockchain Traceability. It prioritizes brands that source directly from cooperatives, ensuring fair pay for farmers and ethical environmental practices.
- 4. Personalized Matching: * For Baking: FitTree recommends
White Chia for its neutral color.
• For Smoothies: It recommends Milled/Ground Chia for maximum nutrient absorption.
• For Value: It identifies bulk organic options like Terrasoul or Amoseeds that meet purity standards at wholesale prices.